
Meet TrendSights: Community Research with Sources and Methods Attached
Explore CloudRaven's AI-assisted community research workspace, watch the public walkthrough, and inspect a worked King County study.
 Robert Schaper • October 20, 2026 • 5 min read
Keep the source roles visible
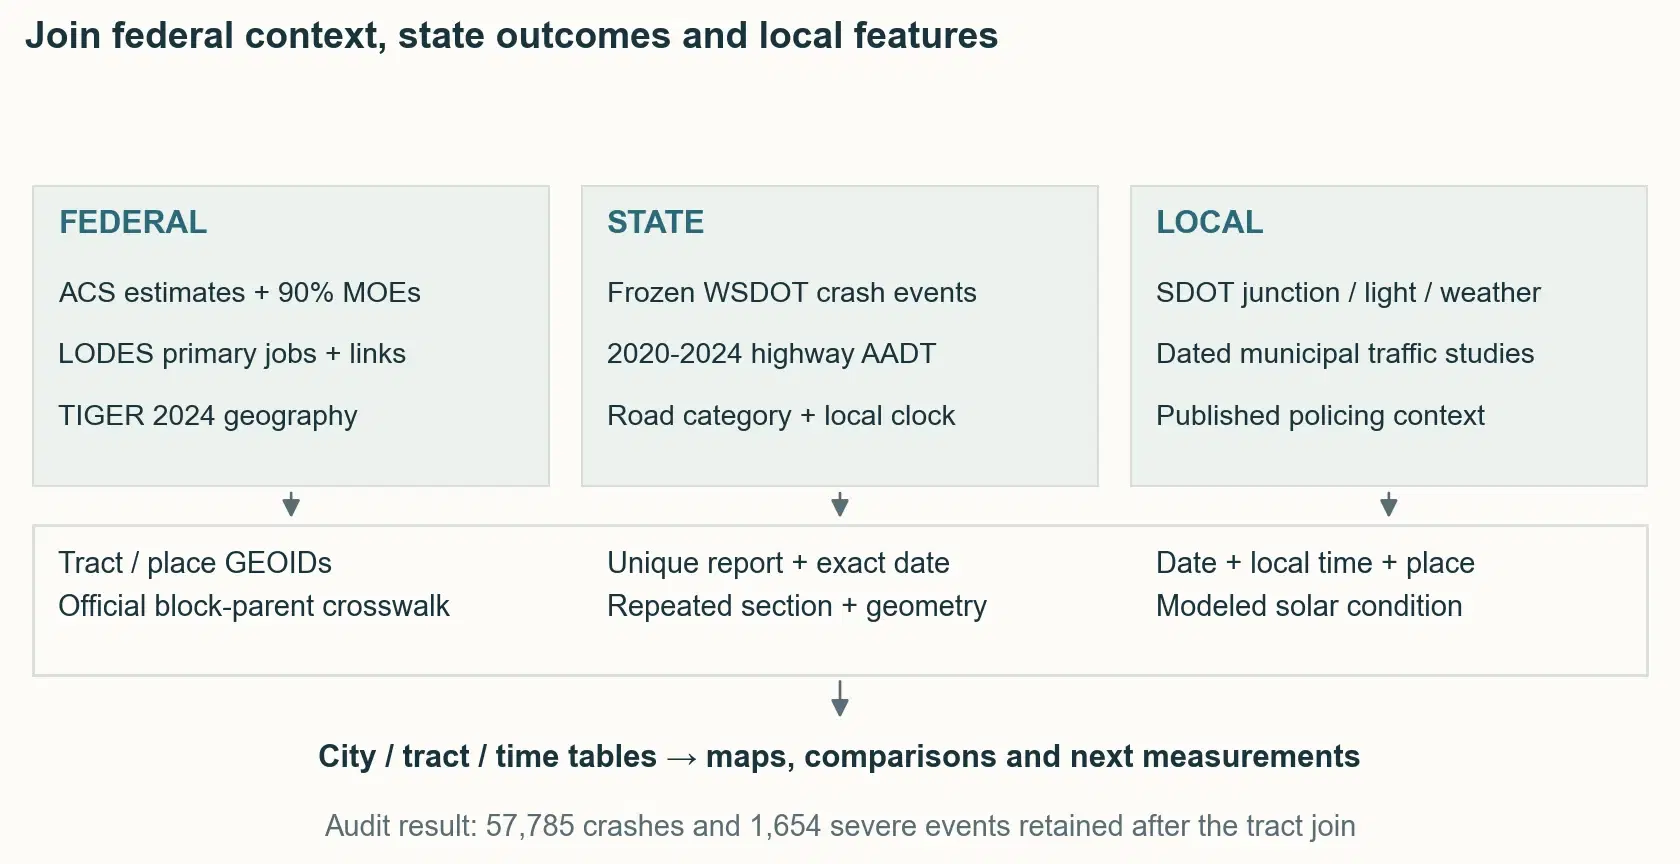
The King County study joins federal context, state crash outcomes, and local features through explicit geography and date rules.
On this page
TrendSights is CloudRaven Labs’ AI-assisted research workspace for understanding communities. It helps community researchers and analysts explore supported public data and create maps, notebooks and briefs with sources and methods attached.
Developed through CloudRaven’s 2026 U.S. Census Open Innovation Labs TOP Sprint work, the current beta focuses on bounded Census descriptions. Available sources, methods and outputs depend on the supported workflow; broader methods have separate validation milestones. Explore TrendSights and request beta access.
The sprint’s focus, “Preparing Federal Open Data for the Next Generation of AI Users,” raises a practical question: can a researcher follow an answer back to its sources, definitions and limits? CloudRaven’s locally developed King County traffic-crash study makes that question concrete. Start with a change in reported crashes, add the right federal and local context, and keep the evidence available for someone else to check.
Watch the public demo
Watch Rob’s original TrendSights walkthrough on YouTube: 2 minutes, 18 seconds, with English captions. Rob Schaper · Tech Team Lead, TOP Sprint 2026 introduces the community-research workflow and its reviewable evidence approach.
Recorded October 19, 2026, this public development demonstration follows a saved community study and the evidence behind its outputs. Available beta workflows may differ from the recorded demonstration.
Begin with a crash question
Why did King County’s severe-crash count rise from 2021 to 2023, and where should a researcher look next?
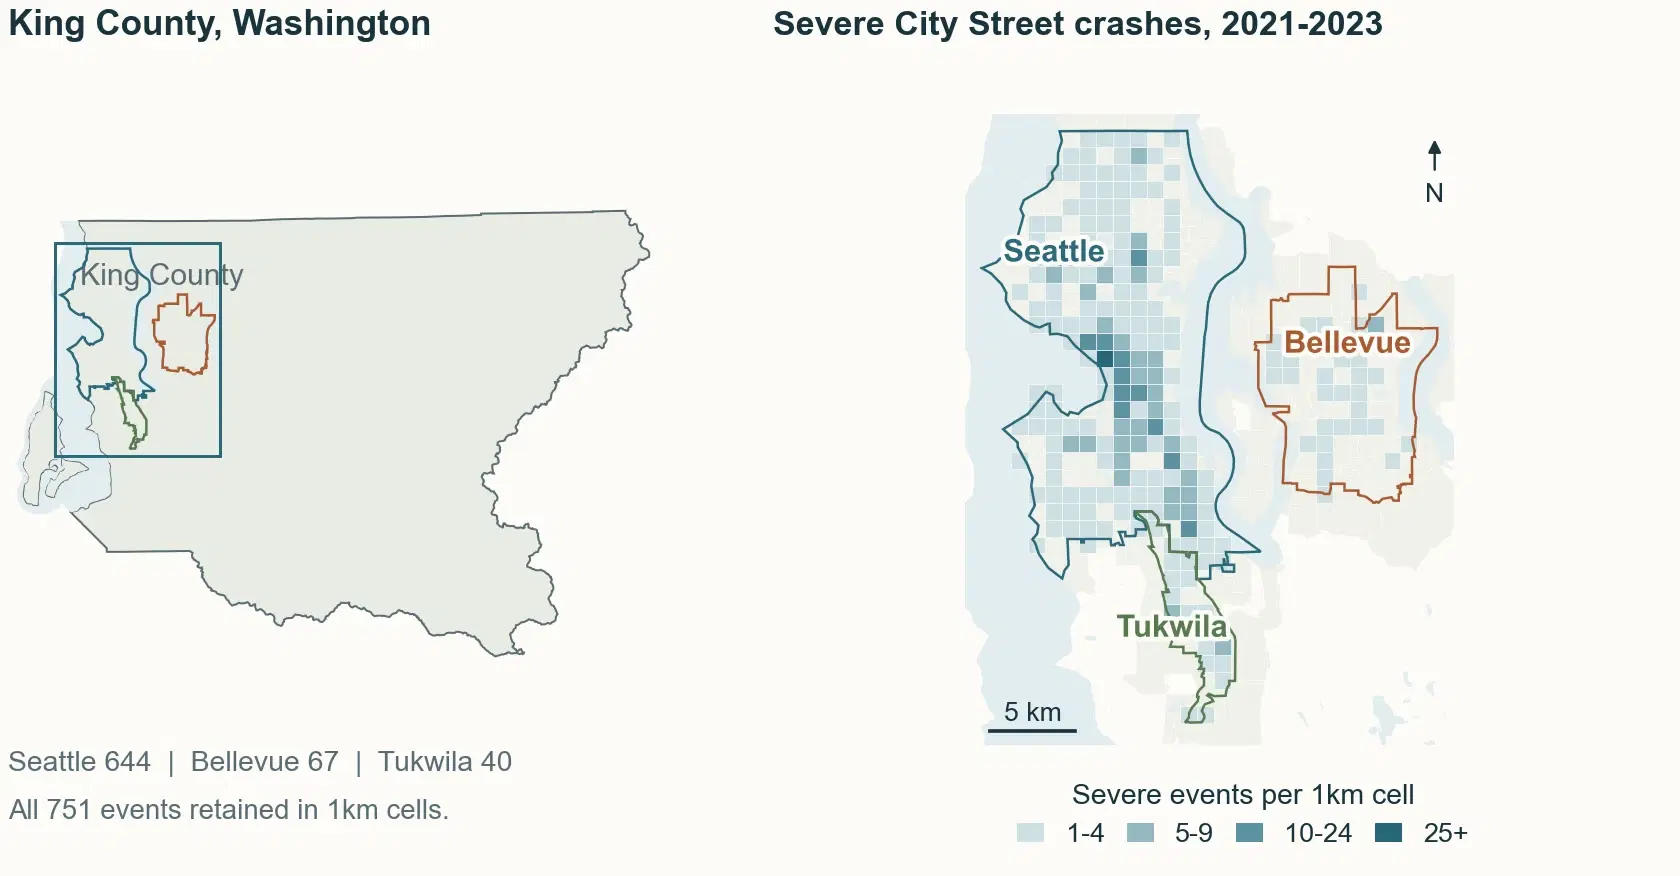
The WSDOT records give us a place to start. Of the county’s 161 additional severe all-road crash events, 138 — 85.7% — fall in the City Street category. Seattle contributes 80 of those additional City Street events. Its intersection-related subset rises from 81 to 138, a change of 57. Bellevue’s City Street net change is +1; that is an all-City-Street comparison, not a comparable intersection change.
Here, severe means fatal or suspected serious maximum injury per reported crash. We are counting events, not injured people.
The full 2020–2024 series also helps keep the story honest. In 2024, Seattle’s severe City Street count falls from 259 to 207; Bellevue’s rises from 21 to 32. Bellevue’s fourth-quarter severe count rises from 6 to 18 between 2023 and 2024 while its all-reported City Street count stays nearly flat, 386 to 385. These are descriptive patterns that need further investigation.
Explore the King County case study for the maps, definitions, and supporting tables.
Add context without changing what the numbers mean
Tukwila makes the distinction useful. Census LODES 2023 counts 42,504 primary jobs at Tukwila workplaces and 10,044 primary jobs held by its residents, a 4.23-to-1 ratio. Of the workplace jobs, 98.2% link to homes outside the city.
That helps us recognize a workplace destination. It does not measure daily commuting, through traffic, daytime population, or crash exposure. Road categories add another layer: 1,024 of Tukwila’s 1,464 reported all-road crashes in 2023, or 69.9%, are State Route records. A dated I-5 section reports AADT of 239,000 vehicles per day; those are section volumes, not unique travelers.
The study also joins ACS 2020–2024 five-year estimates, retaining 90% margins of error and annotations, and verified 2024 tract geography. Residents, resident workers, households, primary jobs, and crash locations keep their own definitions.
Daylight adds a different kind of feature. A NOAA-based approximate solar model uses each event’s date, local time, and location. Modeled night accounts for 42.1% of Seattle’s 2021–2023 severe City Street events (271 of 644), 26.9% in Bellevue (18 of 67), and 45.0% in Tukwila (18 of 40). Seattle’s separately observed lighting reports street lights on for 235 of its 271 modeled-night events. Modeled solar phase and reported lighting are different measurements; neither result establishes a cause or lighting effectiveness.
Browse the artifacts and reuse the derivatives
The case study’s publication browser lets you move through all 21 pages without downloading first. The PDFs preserve vector maps, charts, selectable text, and source links.
| Publication | What to inspect |
|---|---|
| Research story · 9 pages | The question, crash patterns, workplace context, roads, and daylight |
| Research brief · 2 pages | The main findings and follow-up questions |
| Evidence atlas · 8 pages | Time series, source comparisons, geography, and method checks |
| Research design guide · 2 pages | How the evidence is organized for review |
The data and figure library includes CSV and GeoJSON aggregates, vector figures, ACS estimates and MOEs, feature contracts, source receipts, and join audits. A public data ZIP gathers the selected derivatives and method notes. Raw crash identifiers and individual crash points are excluded.
These exports support inspection and further work. They are not a complete executable research environment, an exposure-adjusted risk model, a significance test, a forecast, or a finding about patrol effectiveness.
Keep three examples distinct
These related research examples follow different execution paths:
- The saved hosted TrendSights run demonstrates the product’s saved research and evidence workflow. Its saved outputs are the record of that run.
- The separately executed Kitsap reference notebook and local study illustrate the research method. The descriptive 2021–2023 FARS study reconciles 57 fatal crashes and 62 fatalities across a fixed set of 60 tracts, with ACS 2020–2024 context. FARS contains qualifying fatal crashes, a different outcome universe from the King County WSDOT study.
- The local King County package extends the investigation to Seattle, Bellevue, and Tukwila using the TrendSights research approach, Codex, and human review. It was prepared separately from the hosted product run; it is not automatic product output.
That distinction lets us share useful research while being precise about what the product has actually executed. The TrendSights TOP page provides the program context. The published TrendSights companion brings the detailed King County study, source notes and research outputs together.
Bring the approach to an agency question
The next step for a public-sector team is a question with a useful scope: a place, an audience, an outcome, appropriate sources, and someone responsible for reviewing the evidence.
Our AI Readiness workshop uses that starting point to define a use-case brief, data requirements, review checkpoints, and a practical pilot. CloudRaven is also preparing a standalone federal-data research starter; its public repository remains planned.
Start a workshop planning conversation with the question your team needs to answer. No account is required. For the broader program, visit The Opportunity Project. Participation in TOP and use of Census data do not imply Census endorsement of TrendSights or this research.
Updated October 28, 2026, to clarify the product introduction and link the published TrendSights companion. This article first appeared on October 5 as the public-sector AI Readiness program update; the October 20 edition was written ahead of the October 23 TOP AI Sprint Showcase.
Bring a real community question.
Plan an AI Readiness workshop around your agency’s data, research needs, and review responsibilities.