
CloudRaven case study · TrendSights research approach · October 20, 2026
Follow a crash trend from question to evidence.
Where did severe crashes increase, and what do residents, workplaces, roads, and daylight add to the investigation? A study of Seattle, Bellevue, and Tukwila puts the source evidence within reach.
This is local descriptive research prepared with Codex and human review using the TrendSights research approach. It is a separate research package from the hosted TrendSights demo.
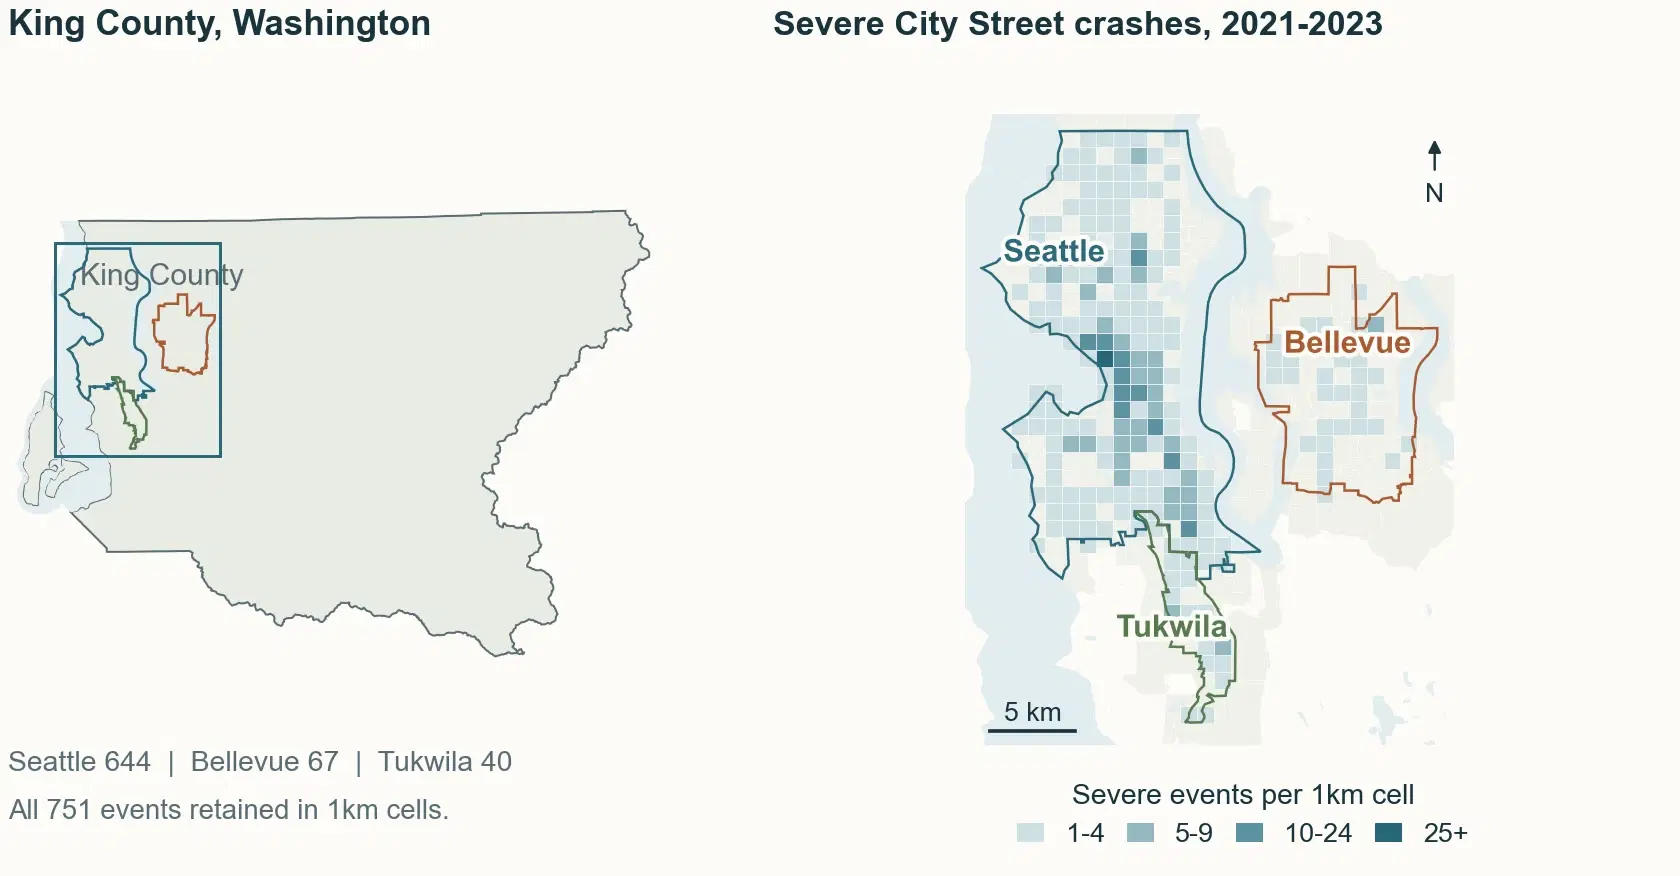
Start with the change. Keep asking what it means.
Here, “severe” means a crash with a fatal or suspected serious maximum injury classification. One crash is one event; it may involve multiple people. Counts and shares describe the reported records.
138 of 161
The county increase concentrates on City Streets.
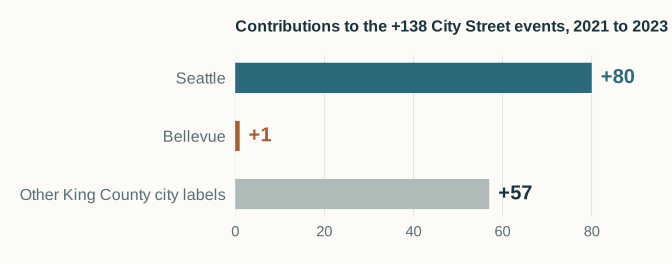
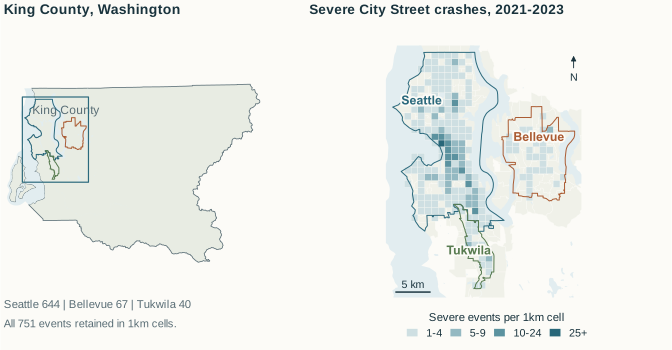
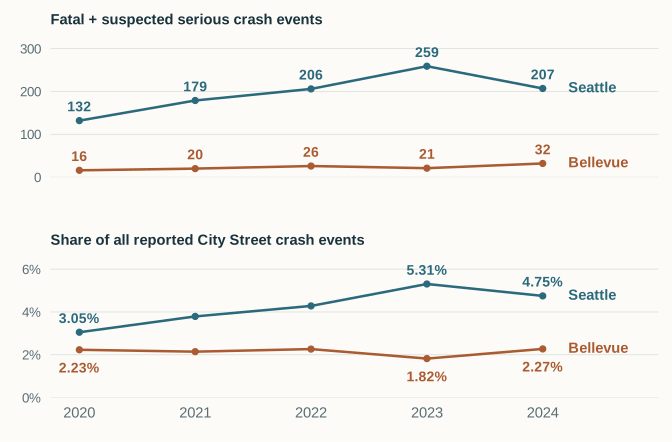
From 2021 to 2023, severe all-road crash events in King County rose by 161. City Street records contribute 138, or 85.7%, of that net increase. Seattle contributes 80 of those City Street events; Bellevue contributes 1.
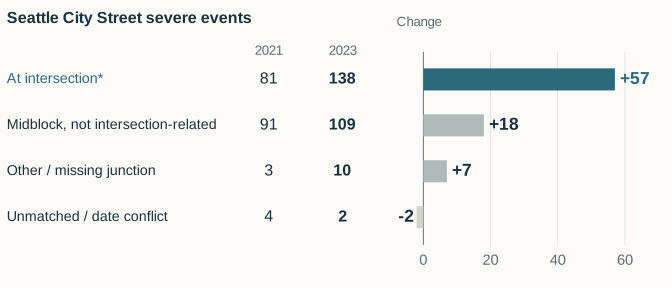
Seattle's intersection-related subset rises from 81 to 138 (+57). Bellevue's +1 is its net change across all City Street severe events; it is a different comparison.
The next year adds another question.
In 2024, Seattle's severe City Street count falls from 259 to 207; Bellevue's rises from 21 to 32. Bellevue's fourth-quarter severe count rises from 6 to 18 between 2023 and 2024 while all reported City Street crashes stay nearly flat, 386 to 385. This describes a change in the recorded mix; it does not identify a cause.
Federal context changes the question
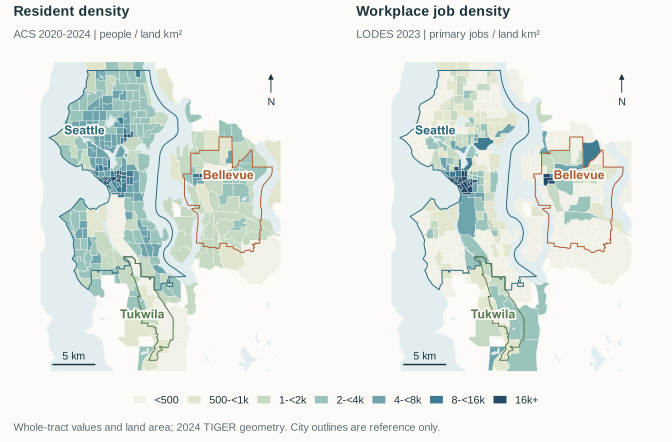
Tukwila is a workplace destination as well as a place to live.
LODES 2023 counts 42,504 workplace primary jobs and 10,044 primary jobs held by Tukwila residents: a 4.23-to-1 ratio. Of its workplace jobs, 98.2% link to homes outside the city. Those relationships help frame the research; they do not count daily commuters.
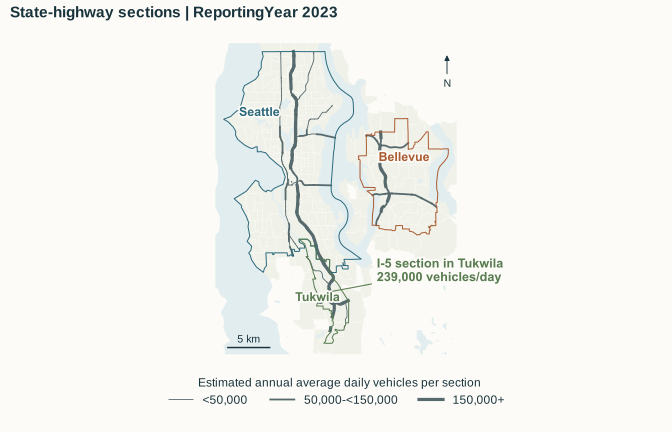
Road coverage matters too. Of Tukwila's 1,464 reported all-road crashes in 2023, 1,024 (69.9%) are State Route records. A dated I-5 section reports AADT of 239,000 vehicles per day. That is section traffic, not unique travelers or a citywide exposure denominator.
Date, location, and light
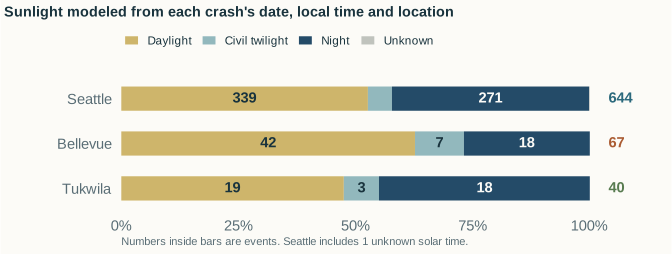
A clock hour does not tell us whether it was dark.
Using NOAA's approximate solar equations, modeled night accounts for 271 of 644 Seattle severe City Street events (42.1%), 18 of 67 in Bellevue (26.9%), and 18 of 40 in Tukwila (45.0%), during 2021–2023.
Seattle's separately reported lighting adds a useful detail: 235 of those 271 modeled-night events were reported with street lights on. The next questions concern visibility, turning movements, and road users; these results do not establish lighting effectiveness.
Open the evidence, page by page.
Choose a publication, move through its pages, or open the PDF for selectable text, vector charts, and source links. The four publications contain 21 pages in total.
Nine pages tracing the crash patterns, federal context, roads, and daylight.
Open full PDF : Research story (new tab)Download PDF : Research storyResearch story · Page 1 of 9 · The question and three-city map
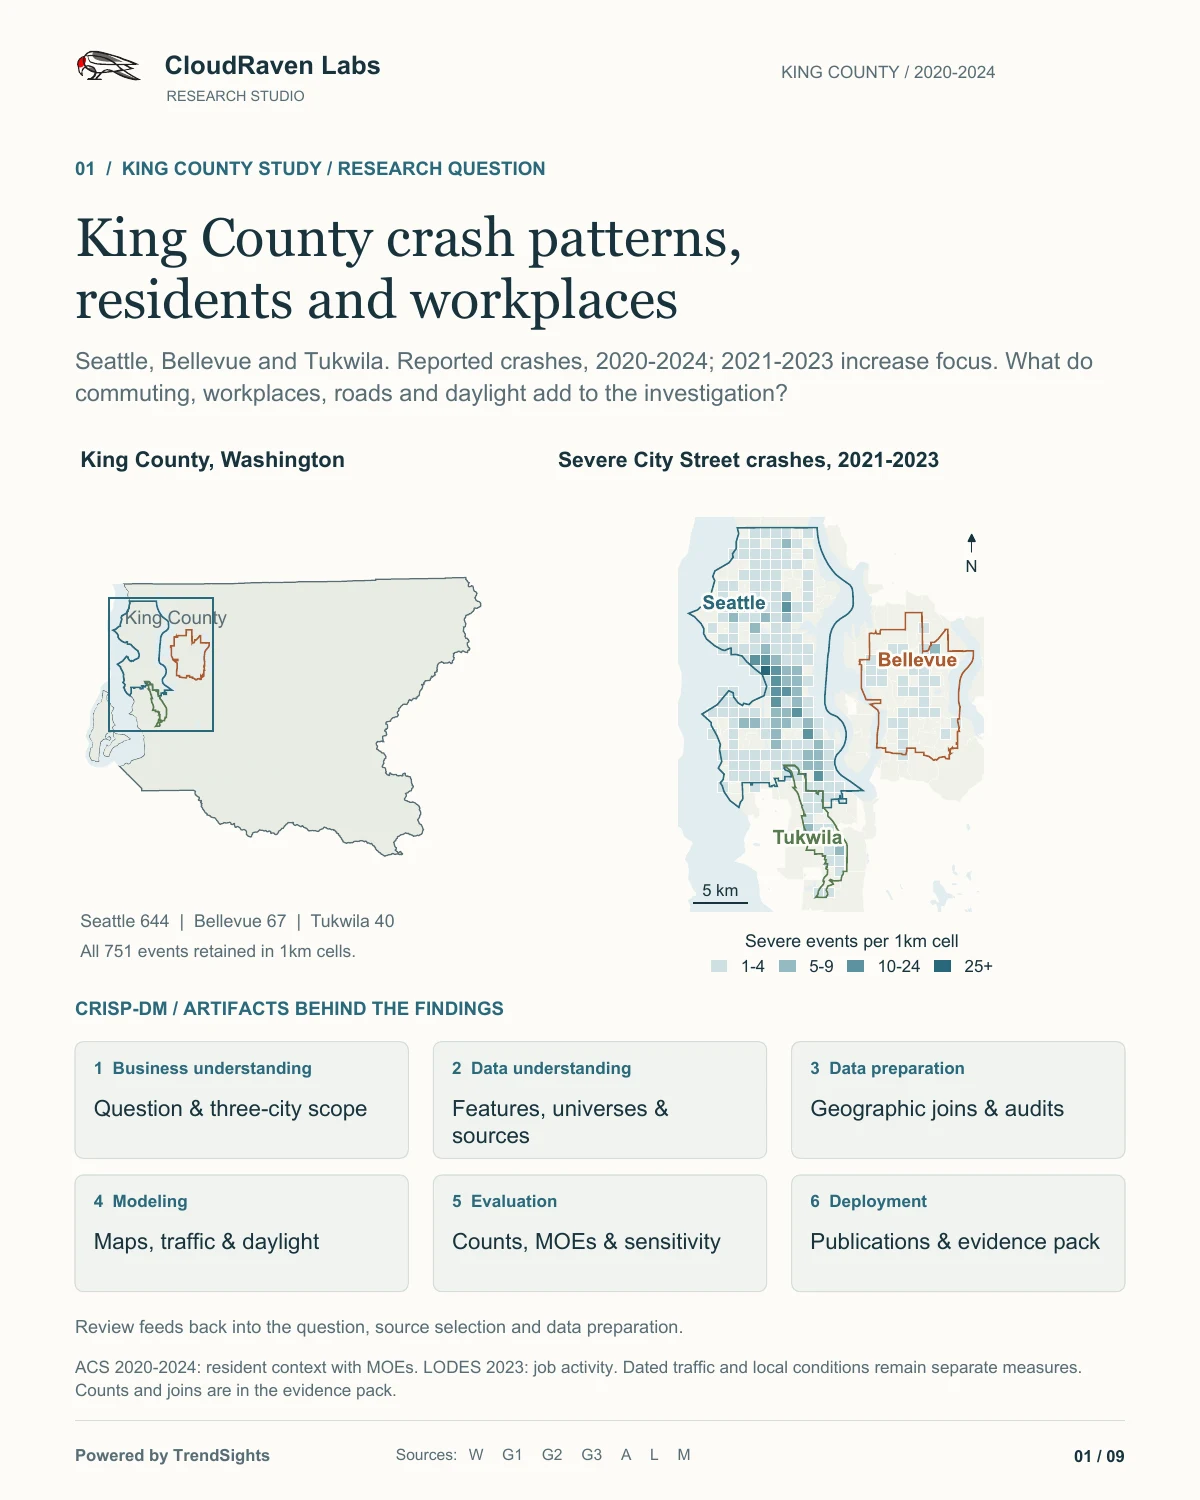
Select the page to enlarge it. The PDF includes selectable text and source links.
Take the evidence into your own work.
Public aggregate derivatives, with the definitions and checks needed to interpret them. Read the source contracts before combining populations, periods, or road categories.
Crash counts and comparisons 5 files
County and City Street counts, quarters, and Seattle junction categories. Severe means fatal or suspected serious maximum injury per crash.
Residents, workers, and primary jobs 4 files
ACS 2020–2024 estimates retain 90% margins of error, annotations, and missing values. LODES 2023 JT01 jobs describe home/work relationships.
Geographic layers 3 files
Aggregate crash cells and whole-tract context on 2024 reference geography. Tract residents are not the people involved in crashes.
Traffic and daylight derivatives 5 files
Repeated highway sections, solar phases, and separately observed Seattle lighting. Section volumes cannot be summed into unique travelers.
Source contracts and checks 10 files
Definitions, source receipts, join rules, count reconciliation, and method limitations for checking or reusing the derivatives.
The ZIP contains selected aggregate data, source contracts, receipts, and method notes. It excludes individual crash points and report identifiers. It is a research handoff; a complete executable research environment and raw snapshots are separate.
Keep the sources and their limits attached.
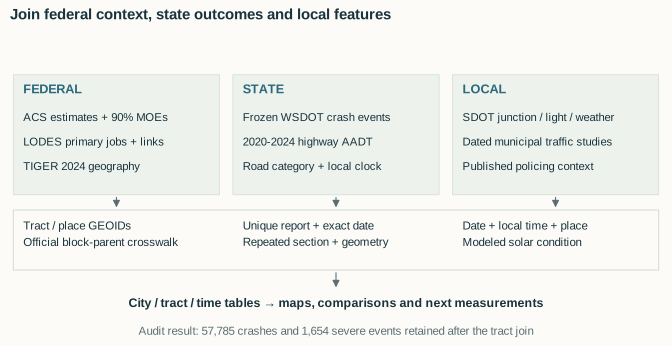
The work follows six CRISP-DM phases, with iteration when a source or join changes the question. The downloadable workflow index maps each phase to artifacts that are available here.
- 01
Frame the question
Set the places, periods, outcome definition, and intended use.
- 02
Understand the sources
Keep each feature’s population, year, unit, and uncertainty visible.
- 03
Prepare and join
Audit geography, dates, source keys, unmatched records, and coverage.
- 04
Describe the patterns
Build maps, time series, road comparisons, and a solar derivative.
- 05
Check the evidence
Reconcile counts, retain MOEs, and examine source and threshold sensitivity.
- 06
Prepare the handoff
Make the publications, aggregate derivatives, and method records inspectable.
2020–2024; frozen October 9, 2026
Crash outcomes; 2021–2023 increase focus. Severe is fatal or suspected serious maximum injury per crash. Temporal comparisons retain WSDOT city and road labels.
2020–2024
Resident, worker, and household context. Matching 90% margins of error, annotations, and missing values are retained. These are separate statistical populations.
2023; JT01; official 2024 block-parent crosswalk
Covered workplace jobs, resident-held jobs, and home/work relationships. No measured daily attendance, through traffic, or daytime population.
2024 reference geography
All 495 King County tracts reconcile across geography and context. Density maps use whole tracts; city outlines provide reference rather than partial-tract allocation.
Annual reporting years 2020–2024
Dated section AADT and geometry-checked repeated sections. A section sample is not a complete city traffic measure; volumes are not unique travelers.
Each event’s date, location, and local time
Modeled solar phase with time ambiguity and ±0.5° threshold sensitivity retained. Seattle reported lighting, weather, and road condition are separate local observations.
Seattle observed junction, lighting, weather, and road condition come from unique report-key and exact-date matches to local records, with unmatched and revised attributes audited. Published policing areas and activity supply reference context; historical duty hours and patrol effects are not established.
This descriptive study establishes no causal effect, statistical significance, forecast, travel-adjusted risk, or patrol effectiveness. Census context describes residents and jobs, not the people involved in crashes. TOP participation and use of federal sources do not imply agency endorsement.
The public demo
See the TrendSights research workbench.
Rob's original 2:18 narrated demo has English captions. It shows the product workflow; the King County package above was prepared separately.
Watch on YouTube (2:18)Continue the research
Bring a question your team needs to answer.
CloudRaven is preparing to share TrendSights at the October 23 TOP AI Sprint Showcase. The detailed TrendSights companion to this study is being prepared for publication.